

At the end of each month, I run a scan on stock and ETFs to look for the formation of new doji buy or sell signals. Dojis are formed when the opening and closing prices are close together. After a doji is formed a close above the doji high or below the doji low will generate a buy or sell signal. The monthly signals are generally stronger and more reliable than the signals on the weekly or daily data. The signal stays in effect as long as the doji low (buy signal) or doji high (sell signal) are not exceeded.

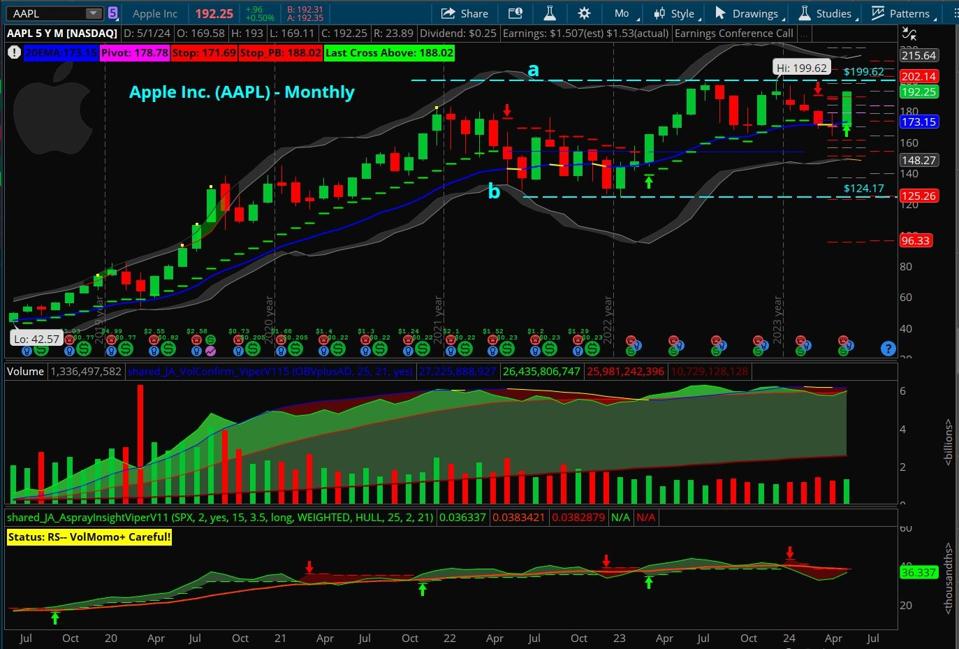
In my scan after the close on Friday, May 31st, 2024 Apple Inc. (AAPL) came up as it generated a monthly doji buy signal. In April, AAPL opened at $170.96, and closed at $170.10 with a high of $178.12 and a low of $163.85. It closed May at $192.32 well above the doji high. The close was 14.8% above the doji low and also above the yearly pivot at $171.43.
The monthly starc+ band is at $215.64 with the yearly R1 at $219.69. On a strong monthly close above the resistance at $199.62, line a, the width of the trading range has upside targets in the $275 area. The volume increased in May and the Vol Confirm has moved above the initial MA but is still below the longer-term signal line. The monthly DTS and Vol Confirm (created along with the chart by Jerry A) turned positive in May. The JA_Aspray Insight is rising as AAPL is starting to lead the S&P 500 higher but has not yet signaled that AAPL is a market leader.

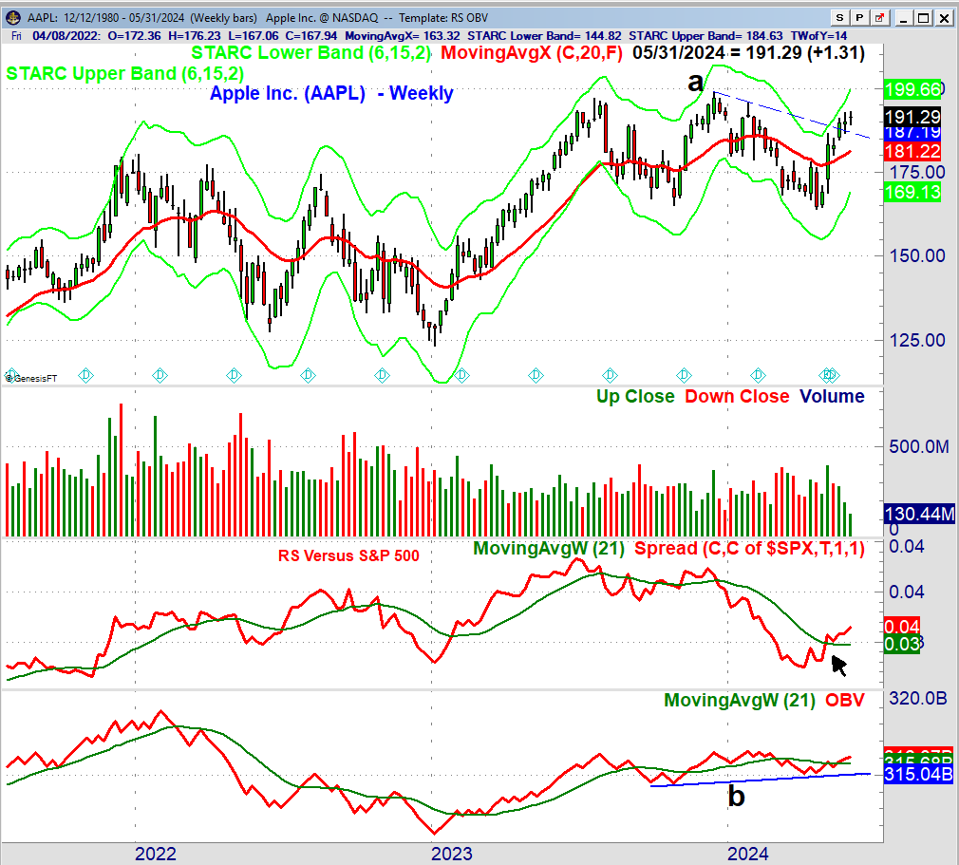
APPL was up 1.25% for the week but closed below the week’s high at $192.99 which is now near-term resistance. The weekly downtrend, line a, was broken three weeks ago and is now at $187.19. The new monthly pivot for June is at $184.39 with the rising 20-week EMA at $181.32. These support levels should hold when AAPl corrects.
The weekly relative performance (RS) measures the performance of AAPL to the S&P 500. The RS has moved above its WMA which is a sign that AAPL is now leading the S&P 500 higher.
The on-balance-volume (OBV) has held the support at line b and moved above its WMA. This is a sign that volume has been increasing as AAPL has moved higher.
The daily technical studies are also positive with the rising 20-day EMA at $186.70 where new buying could be considered. New monthly doji buy signals can often take 2-3 months to turn profitable. For specific stock advice I hope you will try the Viper Hot Stocks Report
Comments
comments